Proposed Forensic Methodology for Quantifying Excessive Loss of Contact in Race Walking
By Jeff Salvage, David Harriman, & Gary Westerfield.
You may watch this paper in the following video or you may read it as a traditional paper here:
1 - Introduction
The following paper proposes forensic methodologies for evaluating excessive loss of contact in race walking events. Race Walk judging is always subjective and often controversial, thus having photographic evidence helps to remove subjectivity. Ideally, record the video with a camera on a tripod in a set position. Further, the video should not be shot panning the camera as athletes progress, because a moving background makes it difficult to measure accurately.
1.1 Definition of Race Walking
Race walking, as defined by World Athletics rule 54.2, states that Race Walking is a progression of steps so taken that the athlete makes contact with the ground, so that no visible (to the human eye) loss of contact occurs. The advancing leg must be straightened (i.e. not bent at the knee) from the moment of first contact with the ground until the vertical upright position.
This definition is highly subjective as there is no objective measure as to what loss of contact to the human eye means.
1.2 Evaluating Loss of Contact (to the human eye)
These methodologies only looks at the loss of contact component, which has been studied as recently as 2019 (Assessment of IAAF Racewalk Judges' Ability to Detect Legal and Non-legal Technique, Brian Hanley). Hanley states, that “40–45ms is an appropriate threshold to adopt as “visible loss of contact.” This range is one accepted by many officials and a reasonable metric. We are also proposing to add two more metrics to the evaluation. Our studies indicate that more than 14 to 15cm of Flight Distance per step across a stride and a ∑ Height Loss of Contact Through a Stride of 100 cm or more (measured with a 120 fps camera) correlate to a visible loss of contact.
2. Methodology
We propose three methods of evaluating loss of contact. Each illustrate a different perspective on assessing excessive loss of contact. The methods include:
- Flight Time, measured in ms
- >Flight Distance, measured in cm
- >∑ (Total) Height Loss of Contact Through a Stride, measured in cm
However, before we begin, we need to calculate the number of pixels per cm in each video clip. Photographs do not have a built in scale or legend, so we have to use ingenuity to determine the number of pixels per cm for each photograph.
- Identify the two frames of the stride with the leg in the vertical position (Figure 1)
and measure the number of pixels from the sole of the foot on the vertical leg through the top of the athlete’s head.
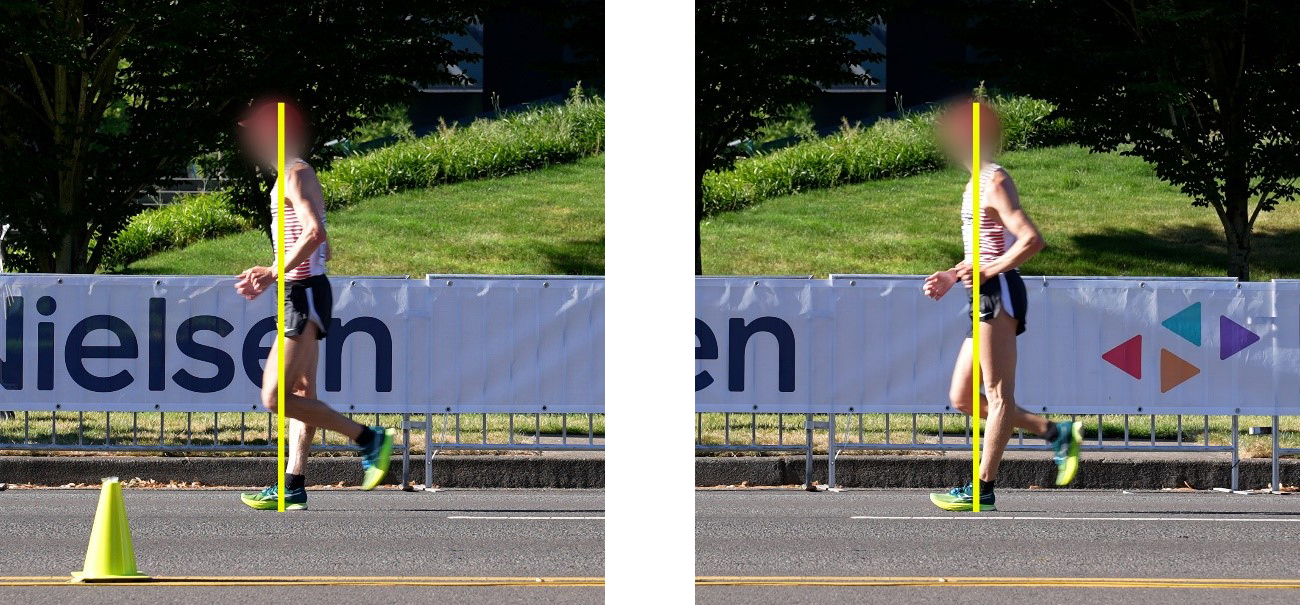 Figure 1- Measuring Height in Pixels
 - Compute the average measurement, because there is a varying angle/distance between the athlete and the camera.
Look up the athlete’s height in cm (most commonly found on the World Athletics or Wikipedia web sites). Based on this information, divide the total number of pixels in our computed average by the height in cm to get the # of pixels per cm in the images used for this athlete’s analysis.
2.1 Loss of Contact Time
Loss of contact time is the number of milliseconds an athlete has both feet off the ground simultaneously. While this can be measured precisely in a lab setting, the accuracy of measurement in a race setting is dependent on the frame rate of the camera used. The higher the frame rate, the more accurate the measurement. When evaluating race walking we have found 120 fps – 240 fps to be ideal. Obviously, 240 fps would appear more accurate, however, often the higher frame rate comes with a lower resolution, so a balance must be struck. 120fps gives an accuracy of ~8.3ms while 240 fps give an accuracy of ~4.16ms.
Observable Loss of Contact Time is not equal for every step. Due to camera angles or asymmetry in the stride, there is frequently visible and measurable differences in loss of contact time per step. Therefore, we measure the Loss of Contact Time for both steps in a stride. We compute the Loss of Contact Time as both the worst case step and also as an average.
To perform the actual measurement for each step, we need to determine the time interval of each frame of the camera. For example if the camera was recording 120 fps, for each complete frame of loss of contact, we add 8.3ms to the flight time. A complete frame of loss of contact is when both feet are off the ground in the previous and next frames.
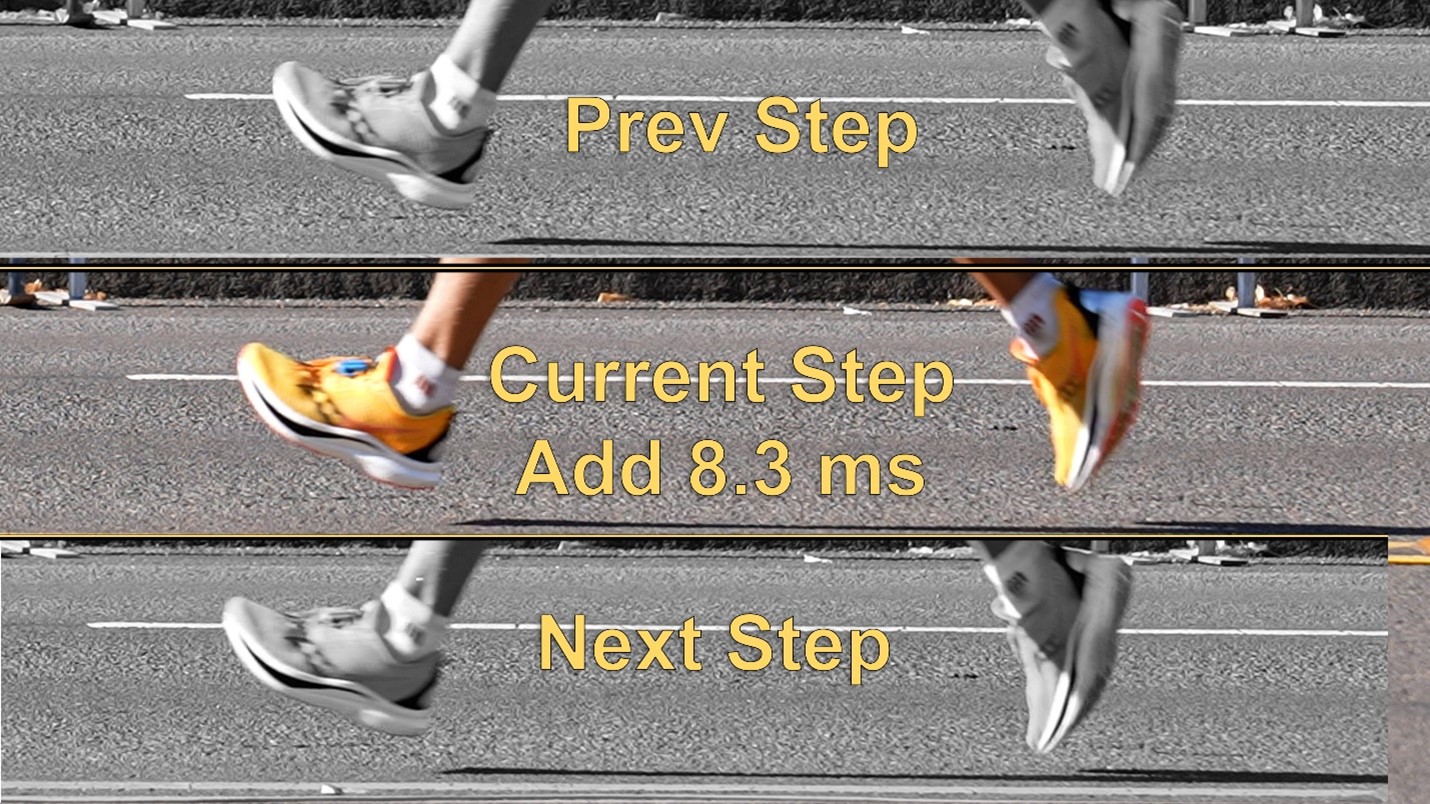 Figure 2A
For the first frame with loss of contact, we make a subjective call whether the transition to a flight phase is immediately before, somewhat before, or significantly before the frame. When it’s obvious that the athlete is off the ground for a significant portion of the time before contact is made, we add a subjective amount of time usually equal to 1/3 or 2/3 of the time for each frame. We perform similar calculations for the last frame of loss of contact.
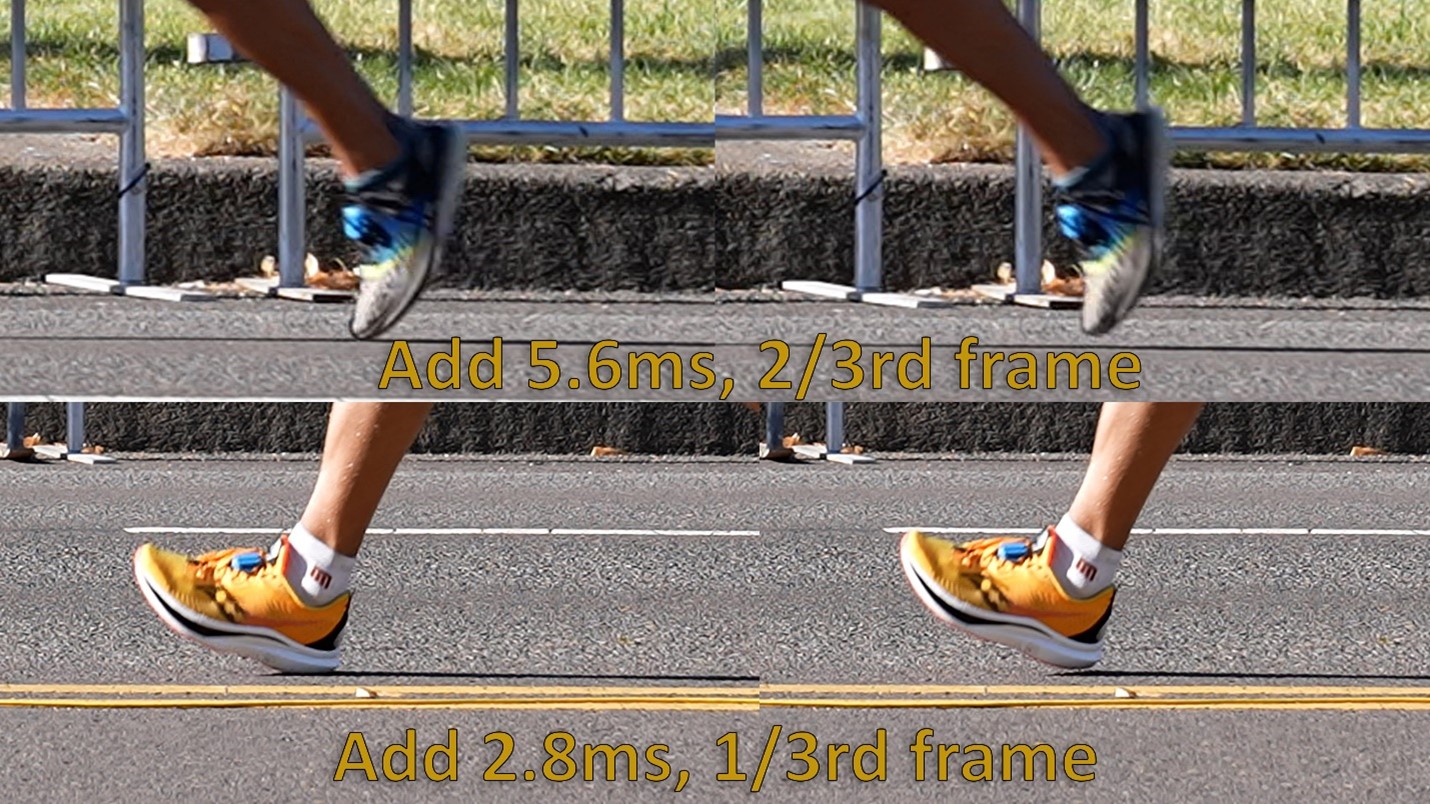 Figure 2B
For example, observe how we calculate loss of contact in ms for the following athlete.
The first image (Figure 3-A) shows the rear foot in contact with the ground, so at this moment there is no flight phase. Our total count of flight time is 0 ms.
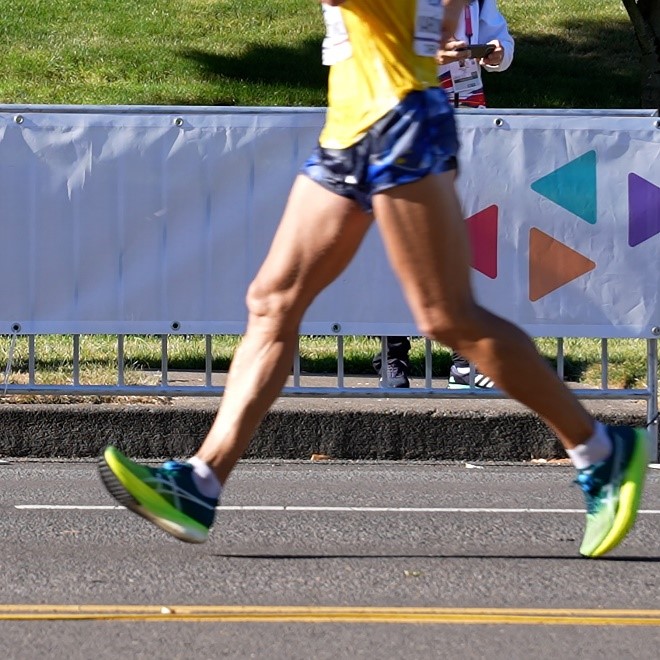 Figure 3A
The second image (Figure 3-B) shows the rear foot just after it loses contact with the ground as well as the front foot being off the ground. We need to look at the next image (Figure 2-C) as well and estimate what portion of a full frame the athlete is off the ground. In this case, we subjectively state the athlete is off the ground for 1/3 of a frame or 2.3ms. Therefore, we add 2.3ms to the total time, and now have an accumulated time of 2.3ms loss of contact.
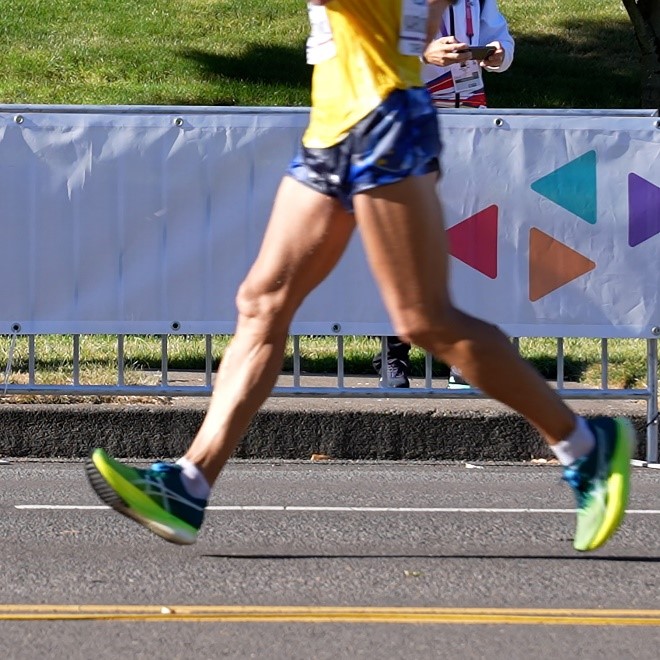 Figure 3B
The third image (Figure 3-C) continues to show the rear and front feet off the ground. Since the previous frame also had both feet off the ground, we add an objective 8.3ms to the total flight time and now have an accumulated time of 10.6ms loss of contact.
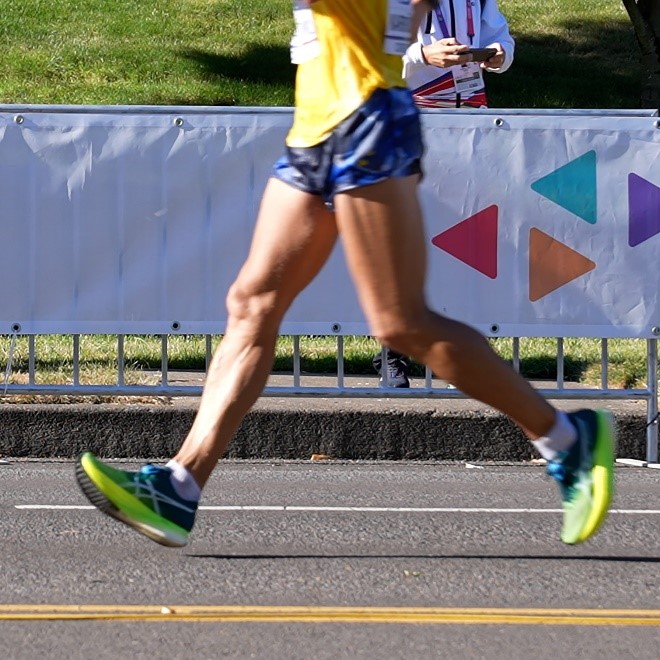 Figure 3C
The fourth image (Figure 3-D) continues to show the rear and front feet off the ground. Since the previous frame also had both feet off the ground, we add an objective 8.3ms to the total flight time and now have an accumulated time of 18.9ms loss of contact.
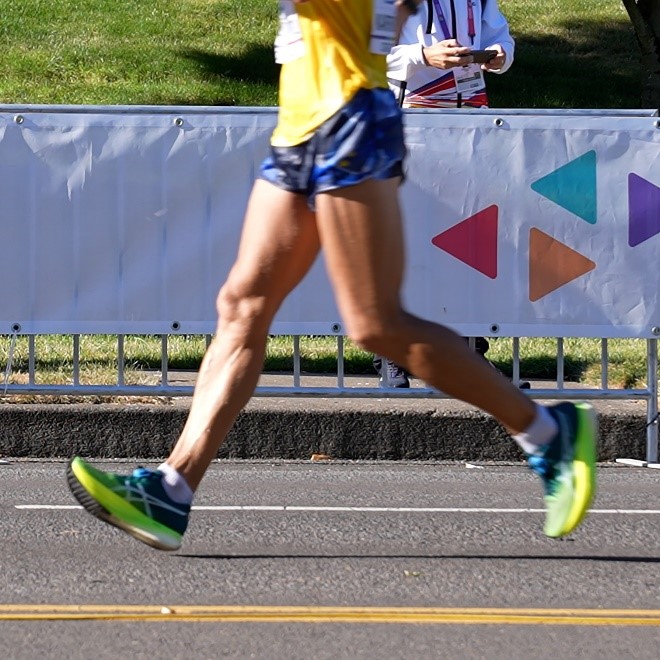 Figure 3D
The fifth image (Figure 3-E) shows the athlete with the lead foot in contact with the ground. We compare the previous frame to this one and add a subjective amount of time based on how much of a frame we subjectively believe the athlete is still in flight between the frames. In this case, we believe the athlete to be off the ground for about 1/3rd of a frame, so we add 2.3ms and get a final loss of contact time of 21.2ms.
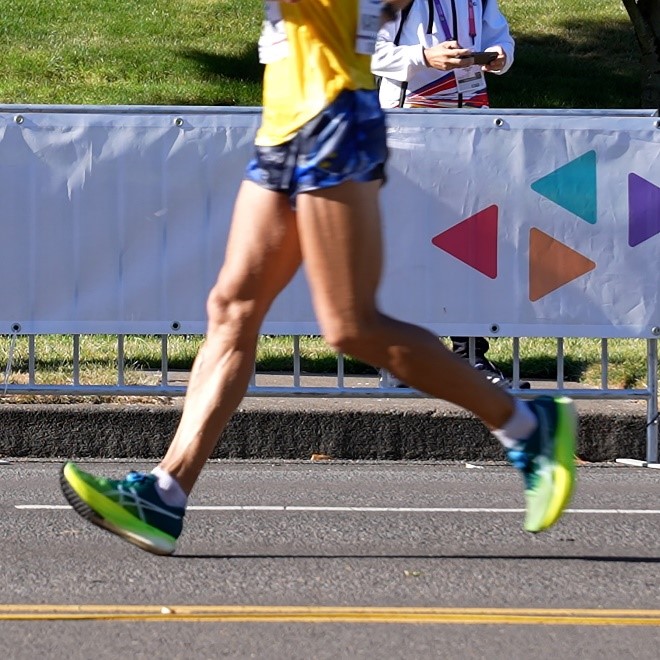 Figure 3E
2.2 Flight Distance
Flight distance is achieved by measuring the length travelled from the moment the rear foot leaves the ground until the moment before the front foot strikes the ground for each step in a stride.
2.2.1 – Example using 120 fps camera
Place two images into a single Photoshop file, the first and last frame the athlete is in flight (see Figure 4-A & B).
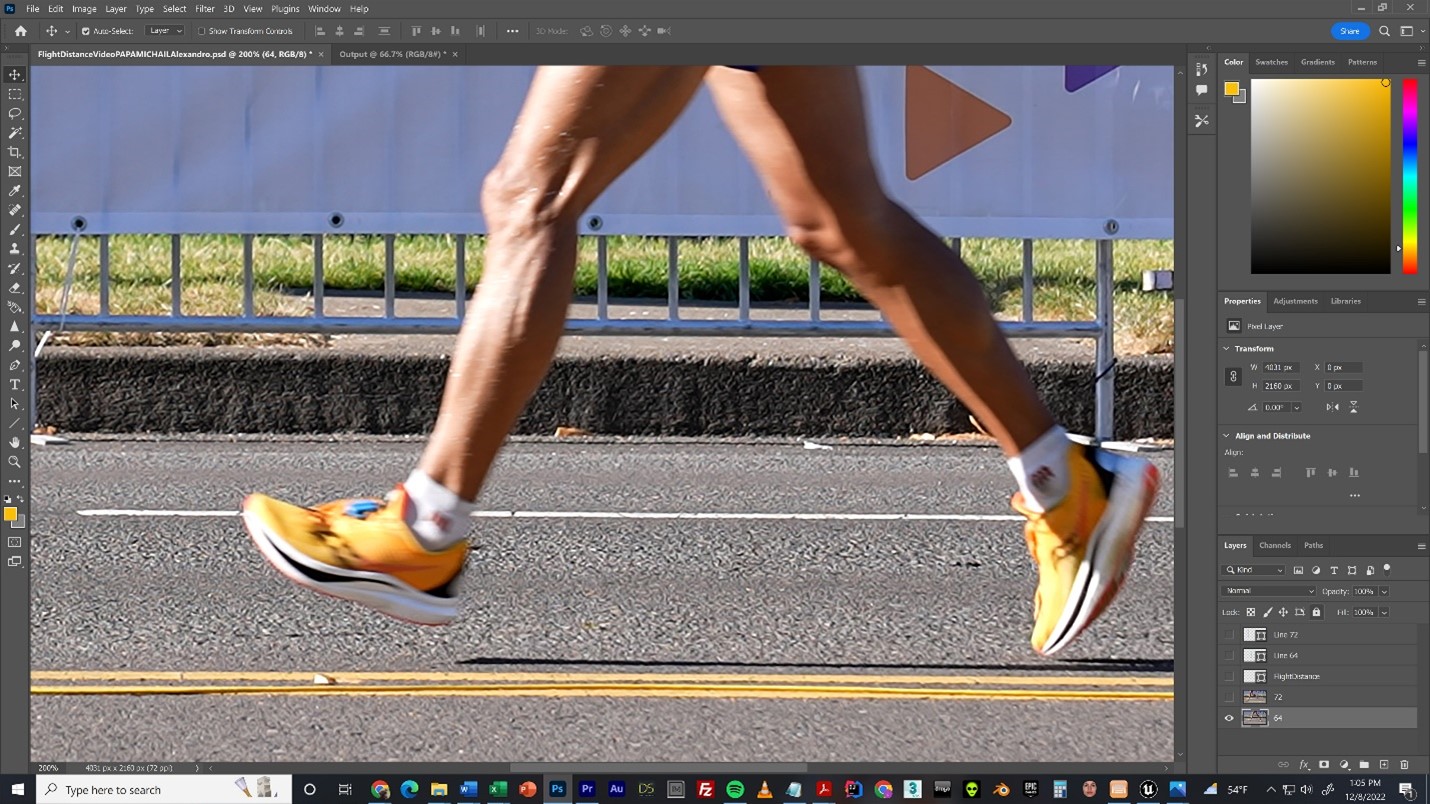 Figure 4A
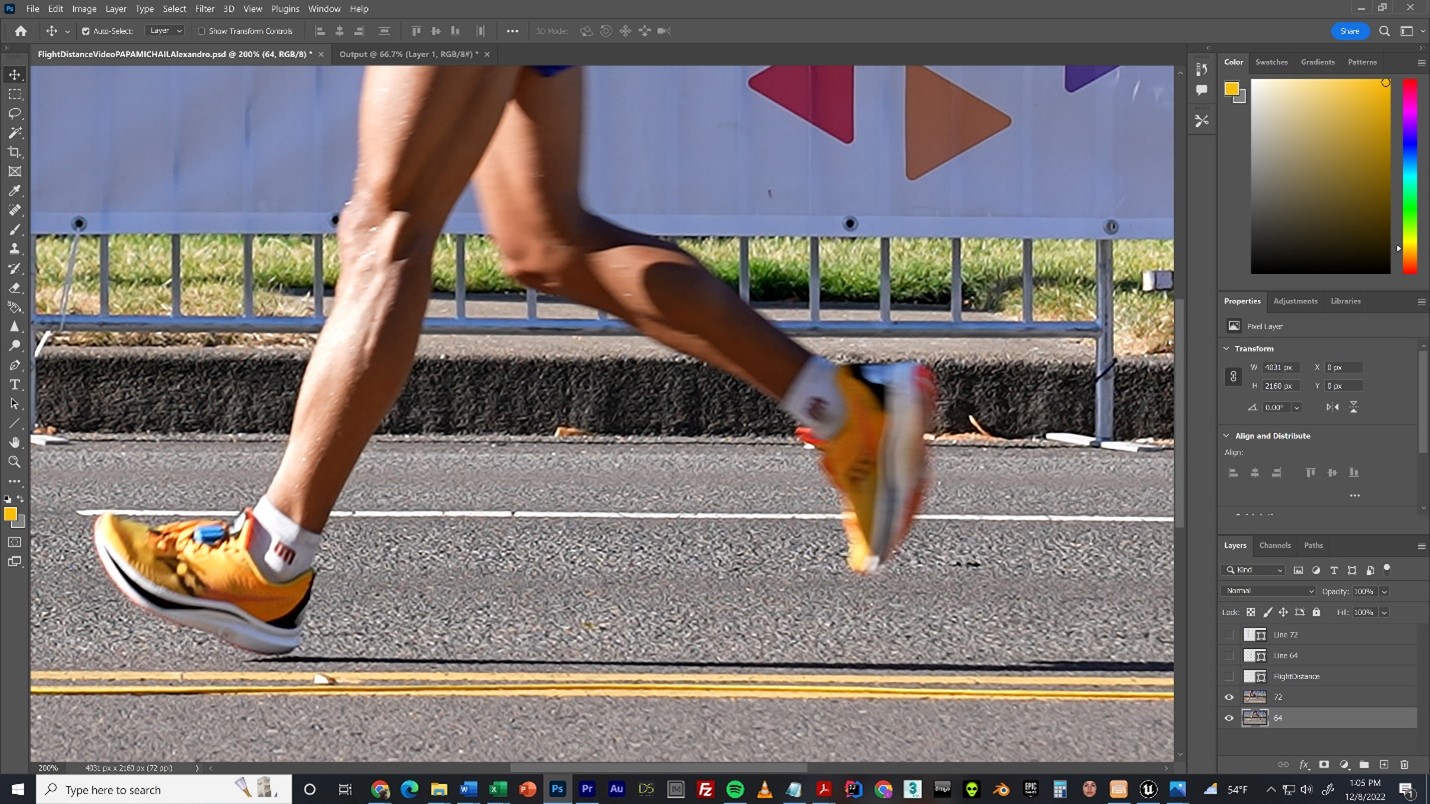 Figure 4B
Draw a vertical line from the rear of the foot in both layers (see Figure 4-C & D).
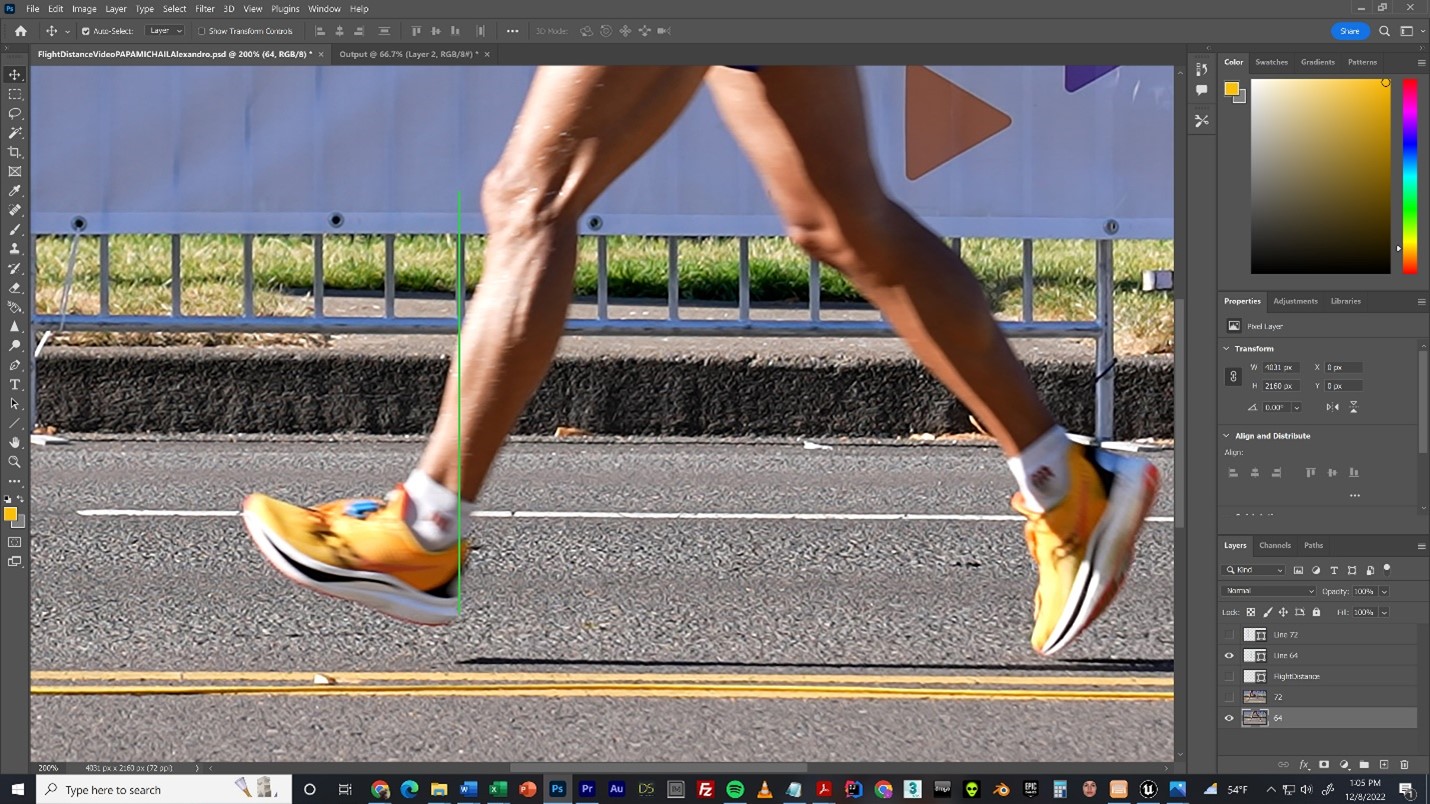 Figure 4C
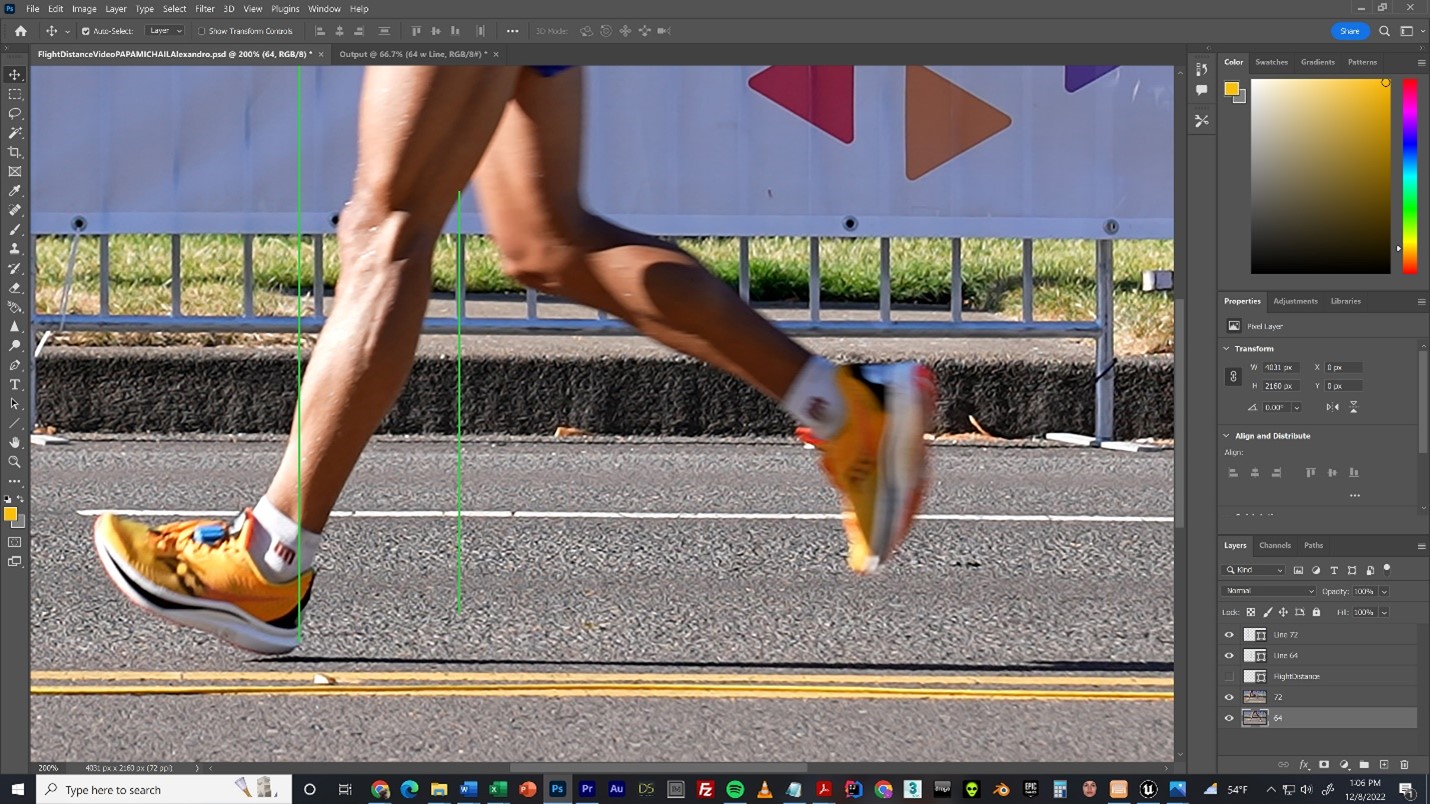 Figure 4D
Measure the distance from one line to the other in pixels (see Figure 4-E).
We already know the number of pixels per cm; therefore, we can calculate the number of cm in the flight phase. Repeat the process for the second step.
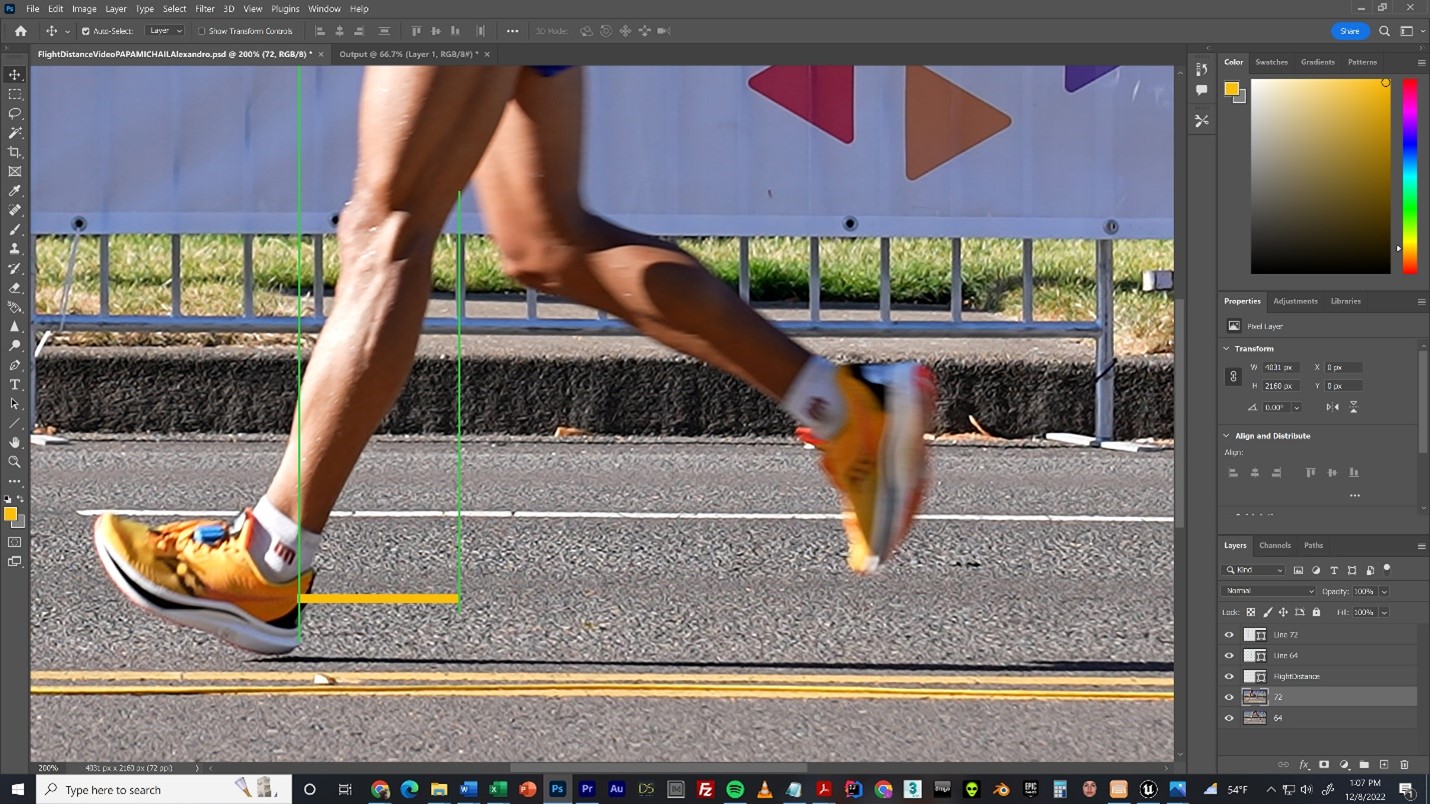 Figure 4E
2.3 ∑ (Total) Height Loss of Contact Through a Stride
- Identify the images needed for an individual athlete.
- Find the video of the desired athlete with a clear view of the feet through a stride. Record video filename. Lookup the time of day of the recording and compute the lap using the World Athletics splits (or other official record) from the race. Export every frame of the stride using the athlete’s name in the filenames.
- To determine the ∑ height LOC through a stride, it is necessary to determine where the ground is in relation to the athlete, and then measure the height of the front heel to the ground and add to it the height measurement of the rear toe above the ground.
- ∑
- Summation
- Step
- A unit composed of successive foot contacts of opposite feet.
- Stride
- A unit composed of successive foot contacts of the same foot.
- Stride Length
- The distance traveled during on stride.
- Load all images in a sequence into Photoshop. Place all the images in a single file, with each frame on a separate layer (Figure 7-A).
- Some images may not be perpendicular to the camera. If so, rotate the image so the road is as horizontal as possible. Draw a horizontal line across the image (Figure 7-B).
- Use the horizontal line as a reference. Select an object in the image that should be horizontal and align the two. In this example, we use the base of the pink and blue signs (Figure 7-C).
- Add a vertical line, in this case along the blue sign (Figure 7-D).
- Align the remaining images, using the horizontal and vertical lines to straighten the images (Figure 7-E).
Load in Photoshop the image with the rear toe about to leave the ground (Figure 5-A).
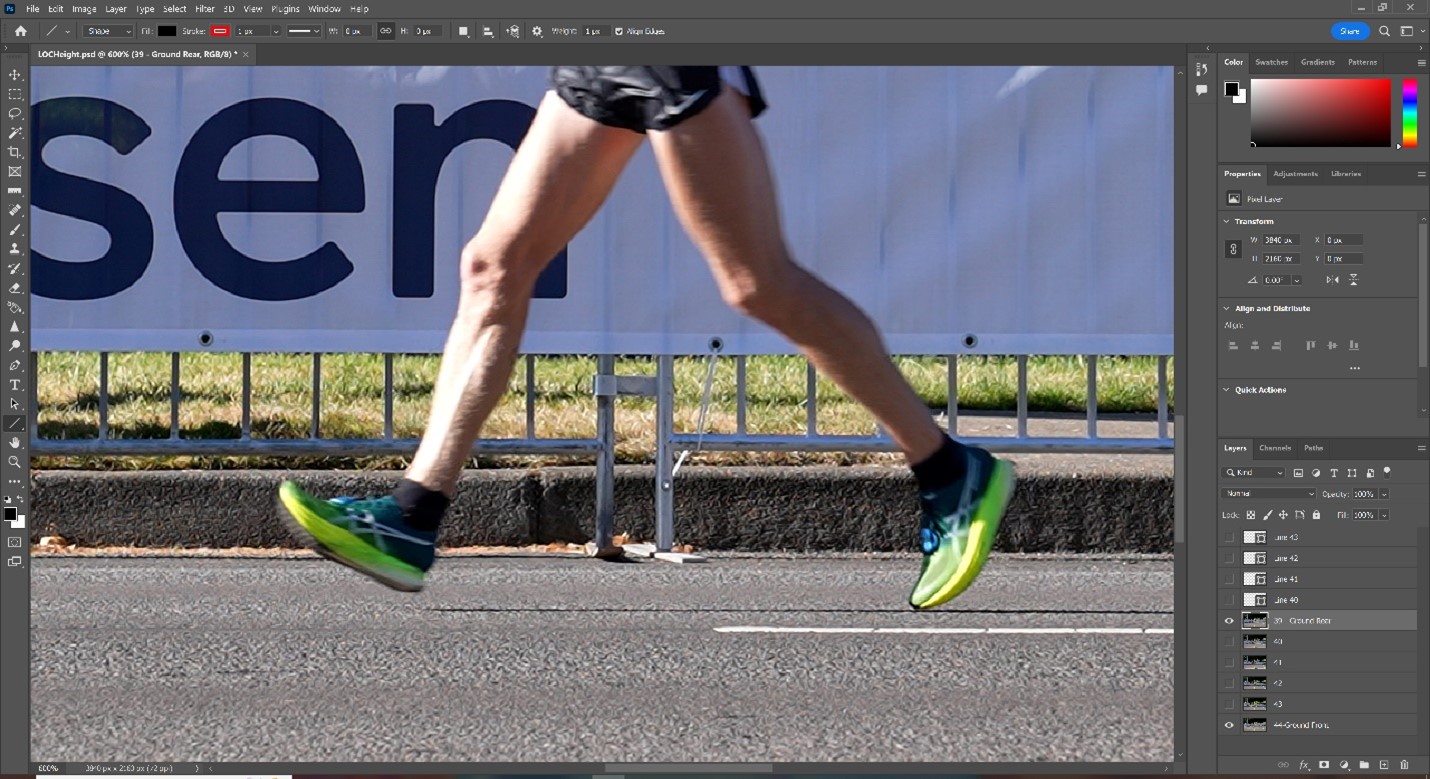 Figure 5A
Mark where the rear foot is in contact with the ground (Figure 5-B).
 Figure 5B
Next, load the next image in the sequence where the forward heel has just made contact with the ground (Figure 5-C).
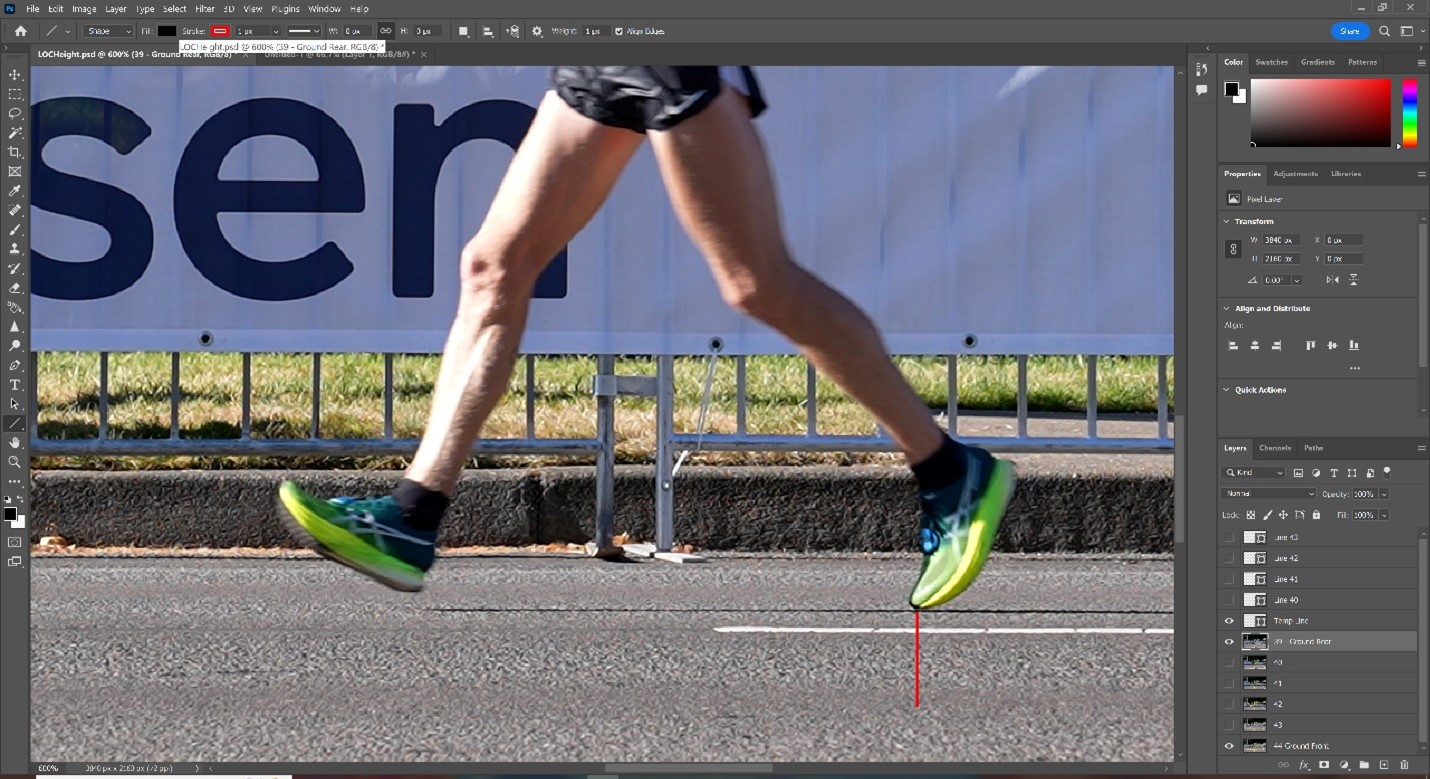 Figure 5C
Draw a line from the original point through the forward heel strike (Figure 5-D).
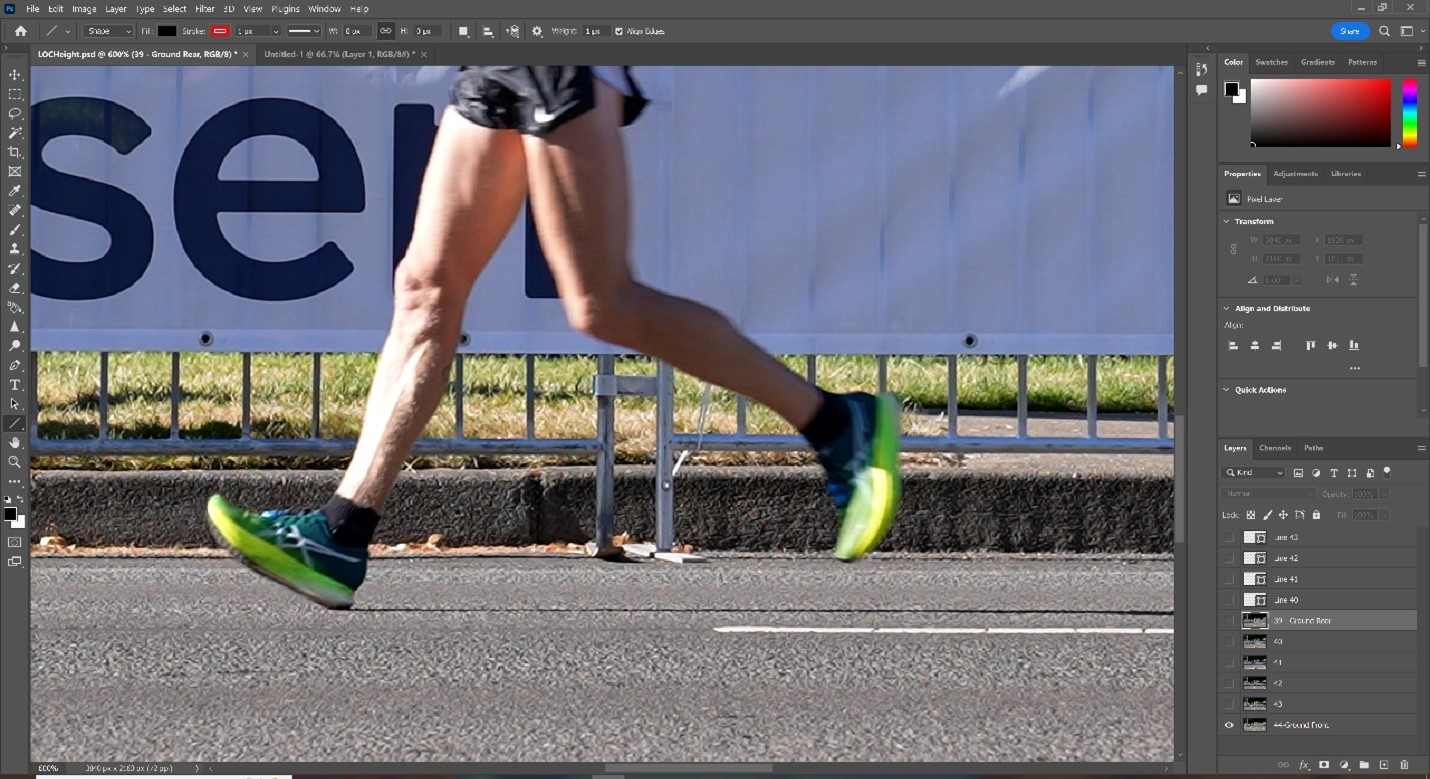 Figure 5D
Check that the line is positioned properly for both points of contact (Figure 5-E).
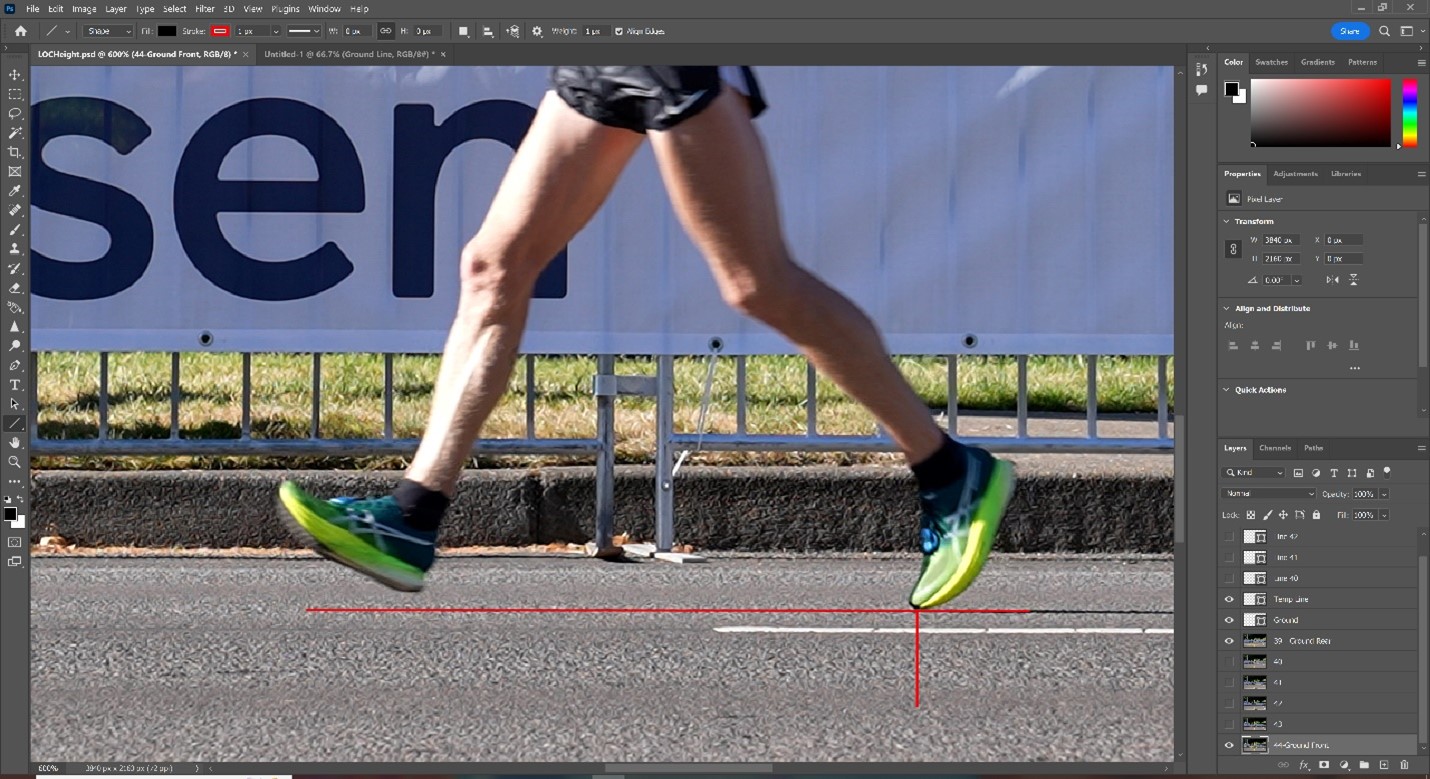 Figure 5E
Next, the image just after toe off is loaded and a measurement from the heel to the ground line is recorded and combined with the measurement from the ground to the toe of the rear foot (Figure 5-F).
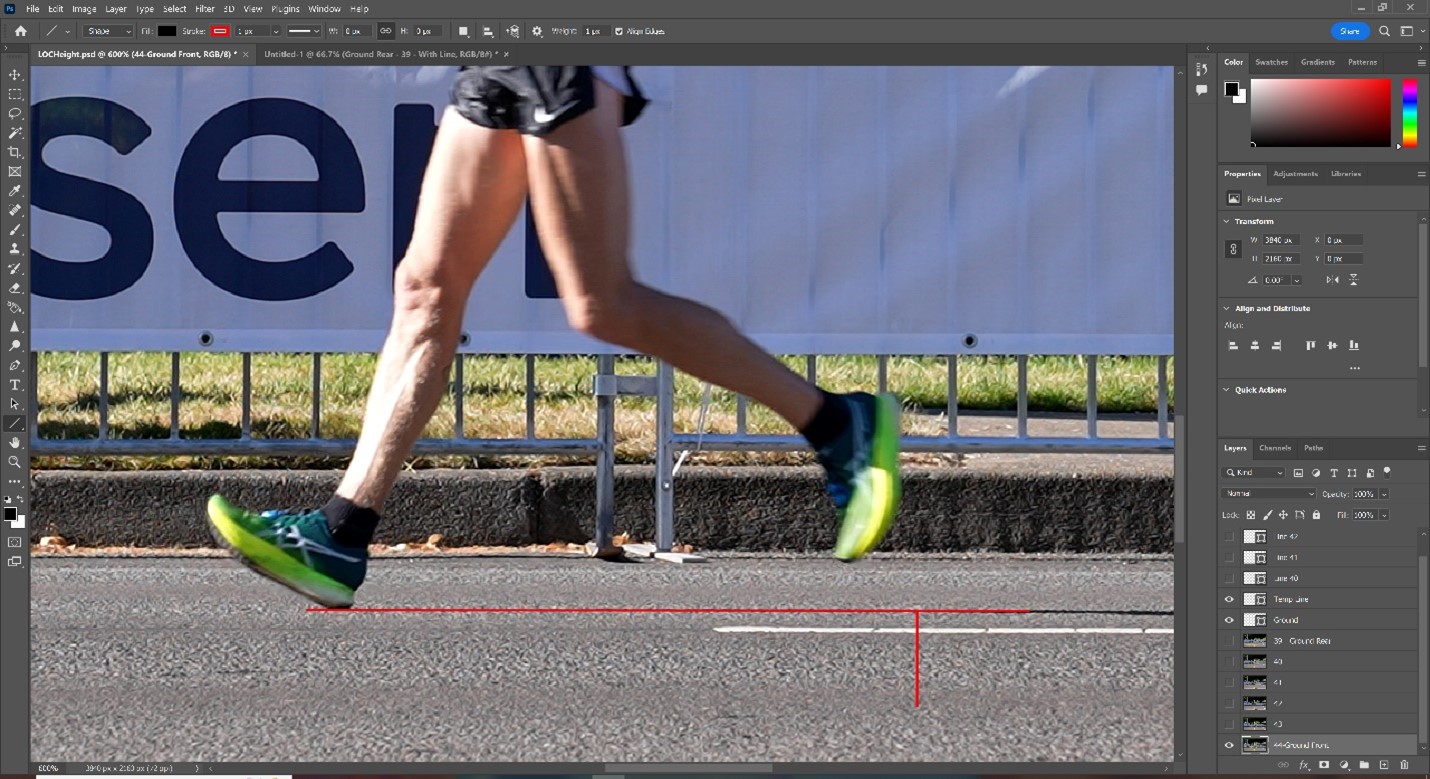 Figure 5F
This is repeated for the all-previous frames (Figure 5-G, -H, and -I). We compute the worst ∑ height LOC for one step as well as the average for a stride.
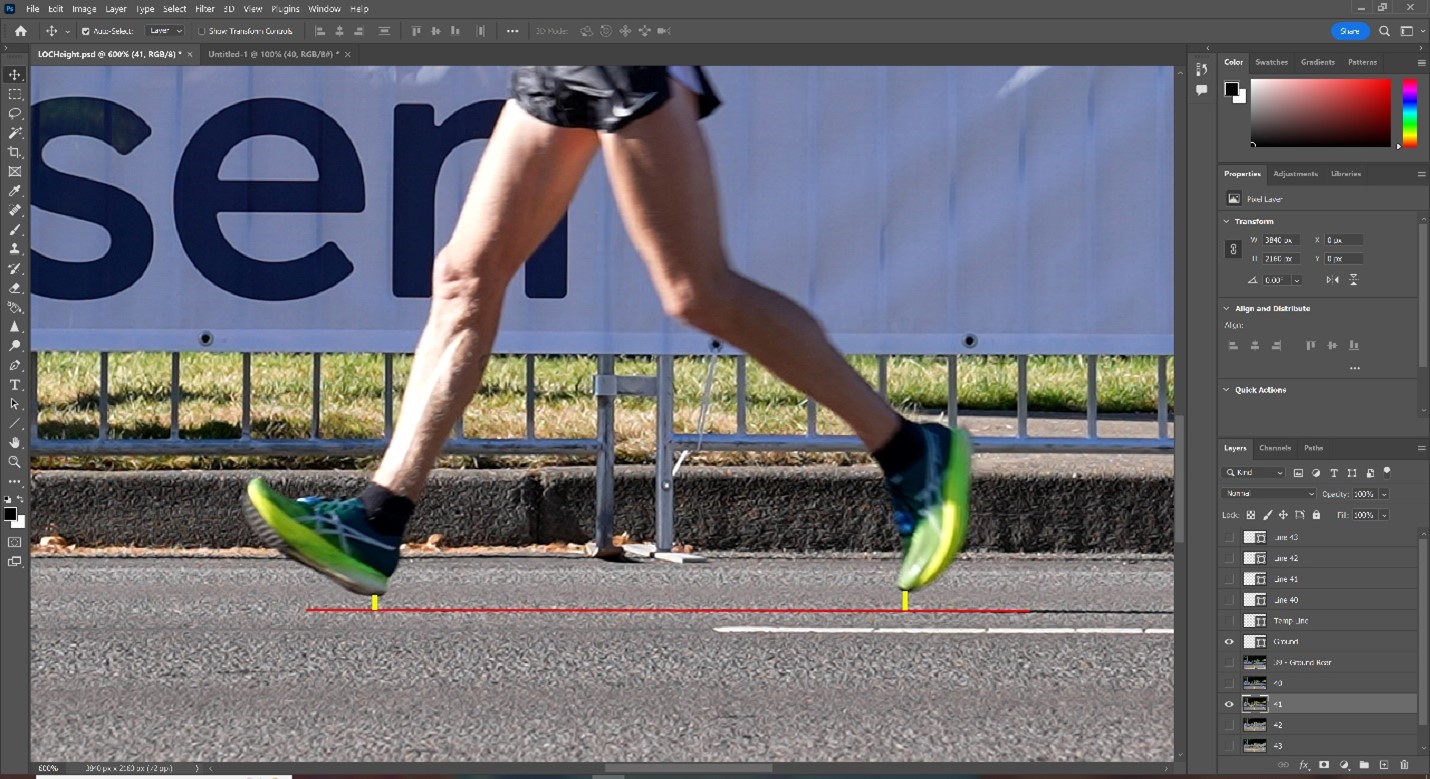 Figure 5G
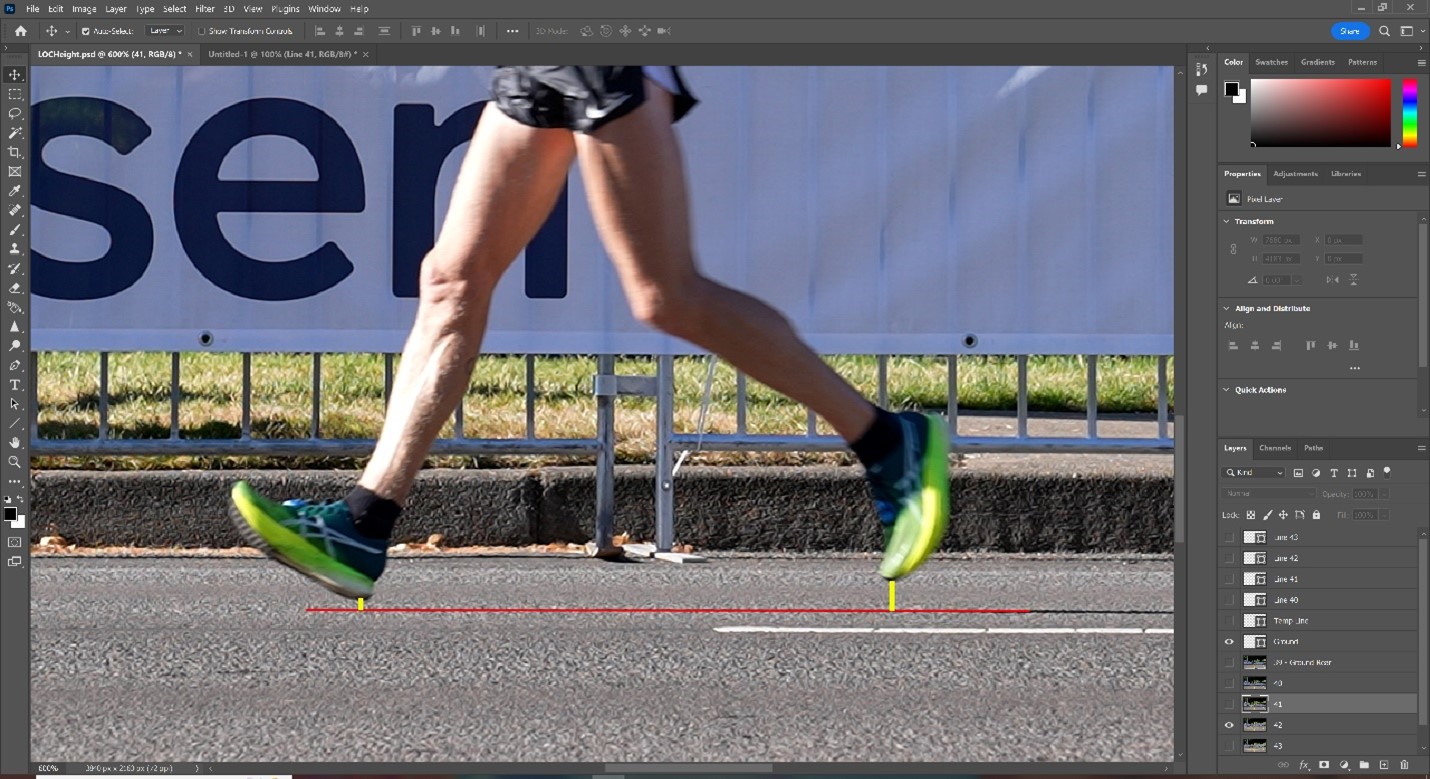 Figure 5H
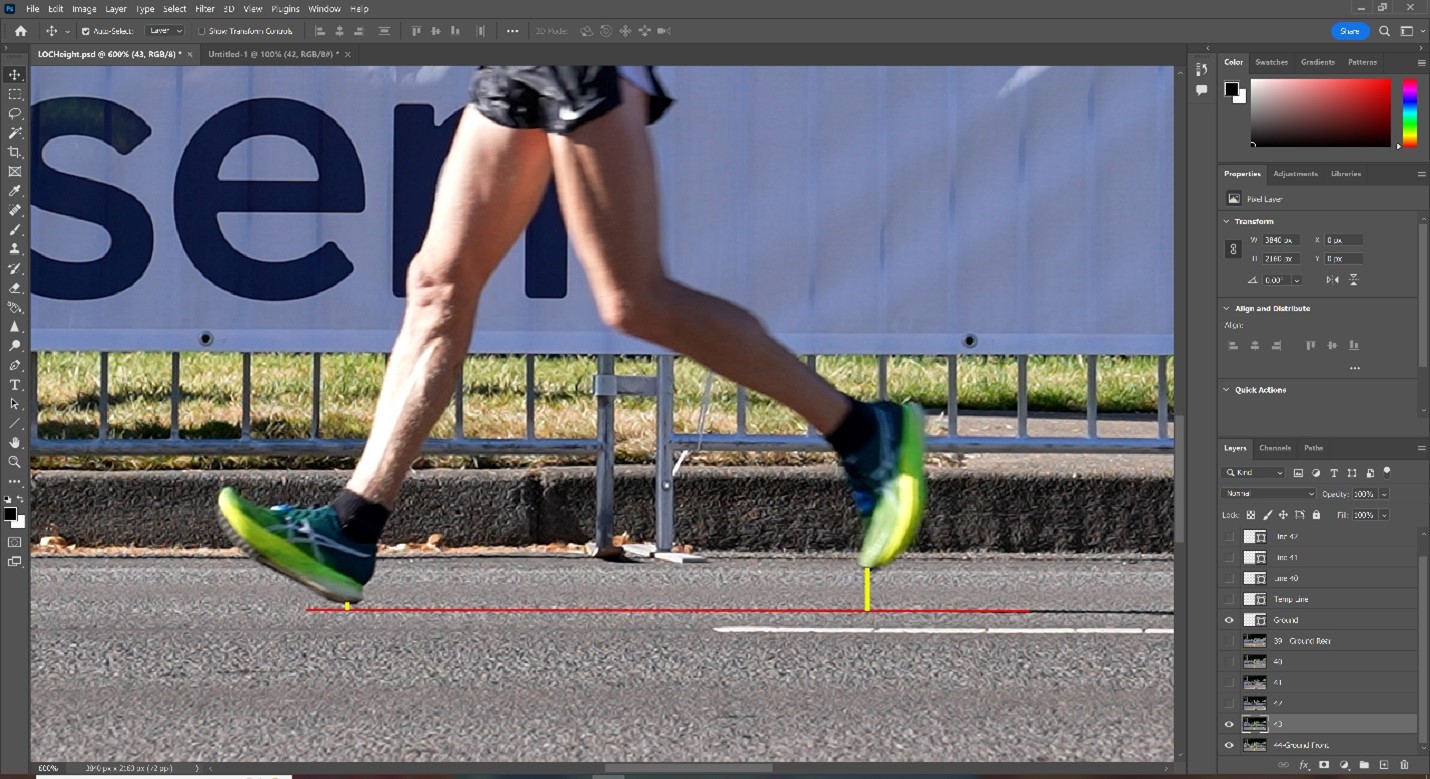 Figure 5I
Not shown, this process is repeated for the other step in a stride.
2.4 Calculate Cadence
When trying to determine loss of contact, the cadence of an athlete matters. Comparing an absolute value for one athlete to another, is more meaningful if their cadences are similar. A much slower athlete will be visibly off the ground with a lesser flight time.
To compute the cadence, count the number of frames from toe-off of one foot until toe-off of the same foot. Cadence is calculated by dividing the frames per second (FPS) of the camera by the number of frames from toe-off to toe-off * 60 (number of seconds) * 2 (to derive at the number of steps vs. the number of strides).
2.5 Calculate Stride Length
It is also interesting to note and easy to obtain an athlete’s stride length.
Measure the pixels between the toe-off of one foot until toe-off of the same foot. This requires identifying the absolute toe-off spot in two different frames. Place each image into a single Photoshop file, with each image as a separate layer. Add a blank layer above both. Draw a vertical line in the blank layer from the point of toe-off to the top of the image for both toe-offs. (Figure6-A and -B) Measure the number of pixels between the two lines (Figure 6-C). Convert number of pixels to cm.
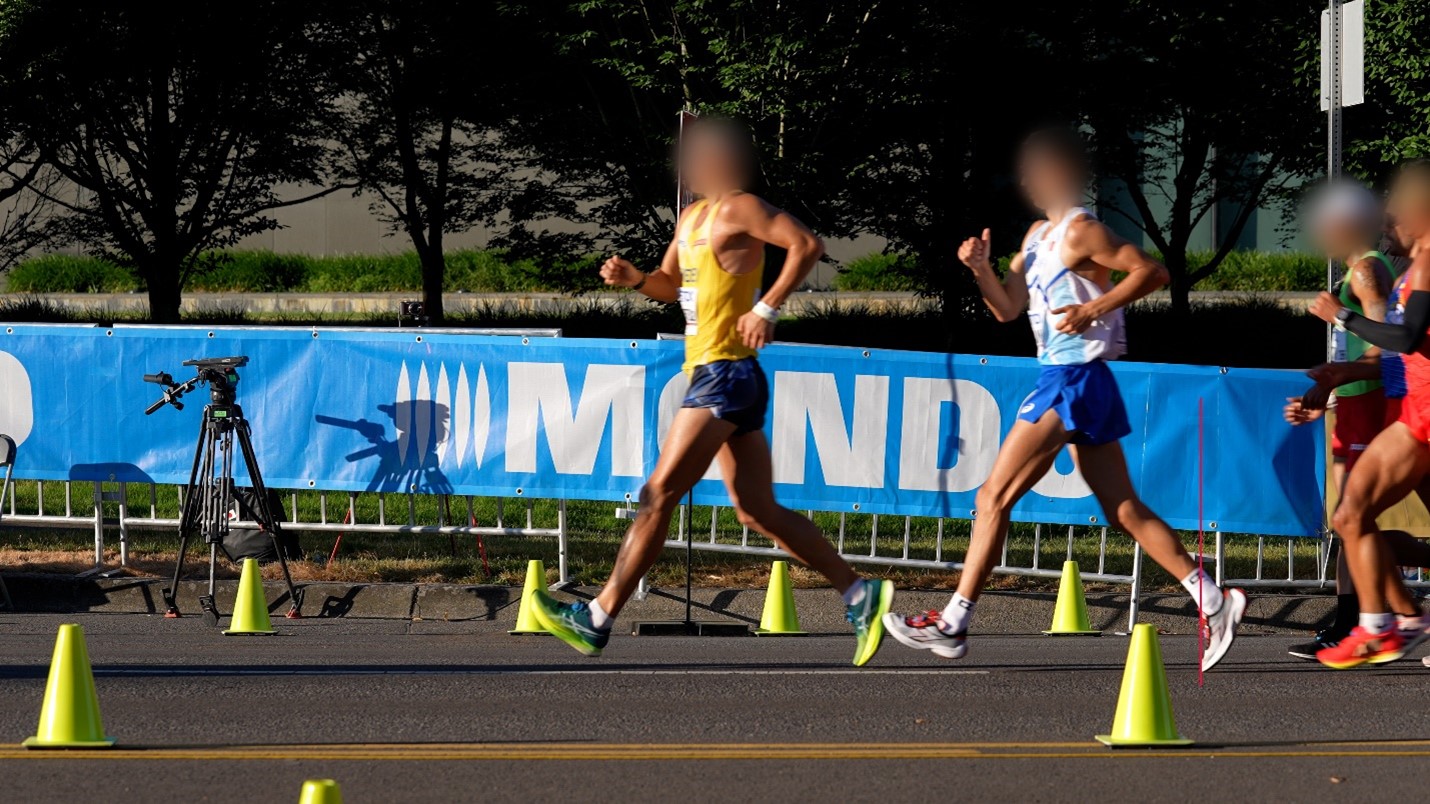 Figure 6A
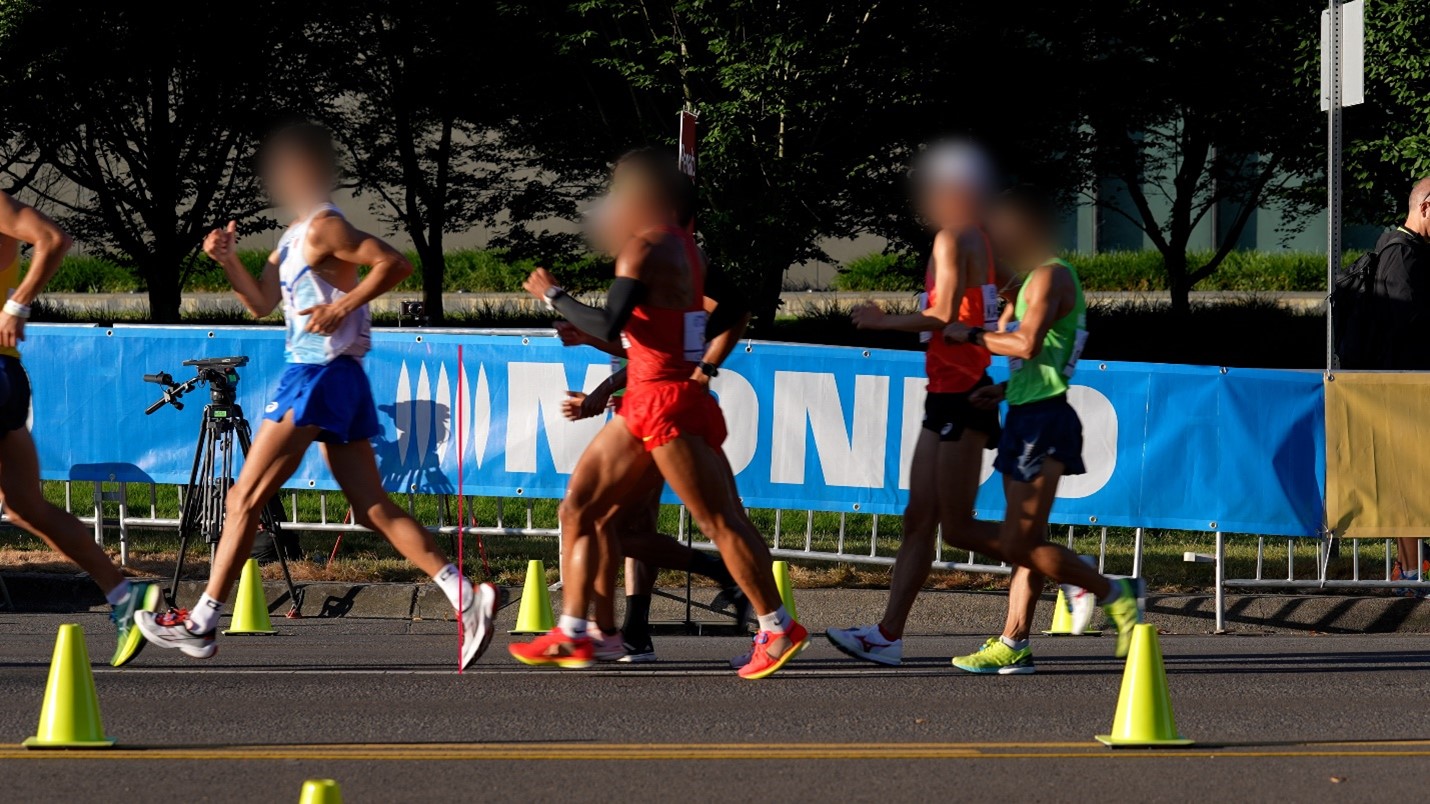 Figure 6B
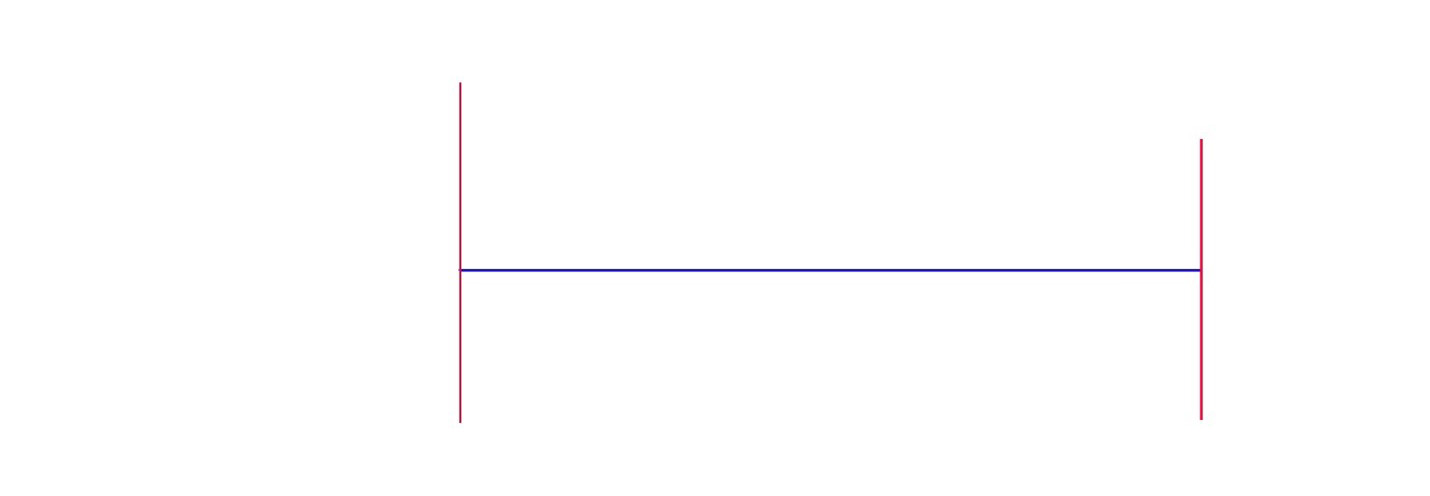 Figure 6C
4.0 Summary
We have shown how to calculate visible loss of contact employing three metrics; flight time, flight distance, and summation of height loss of contact. Accumulated data from these metrics for a race walk event should be compared to the judging history of the race. Judging evaluation would correlate loss of contact Yellow and Red Paddles shown on the race Summary Sheet to the photographic data. Then controlling for race conditions and judging positions on the course, this enables us to more accurately evaluate the judges.
Appendix 1 – Glossary
Appendix 2 - Converting Panned Images to a Static View
If you were unable to get fixed images, and use a camera that was panned with the athletes, this complicated taking consistent measurements. The following steps allow you to convert panned images into static images, with a reasonable margin of error. Therefore, each image analyzed must be aligned using the following steps.
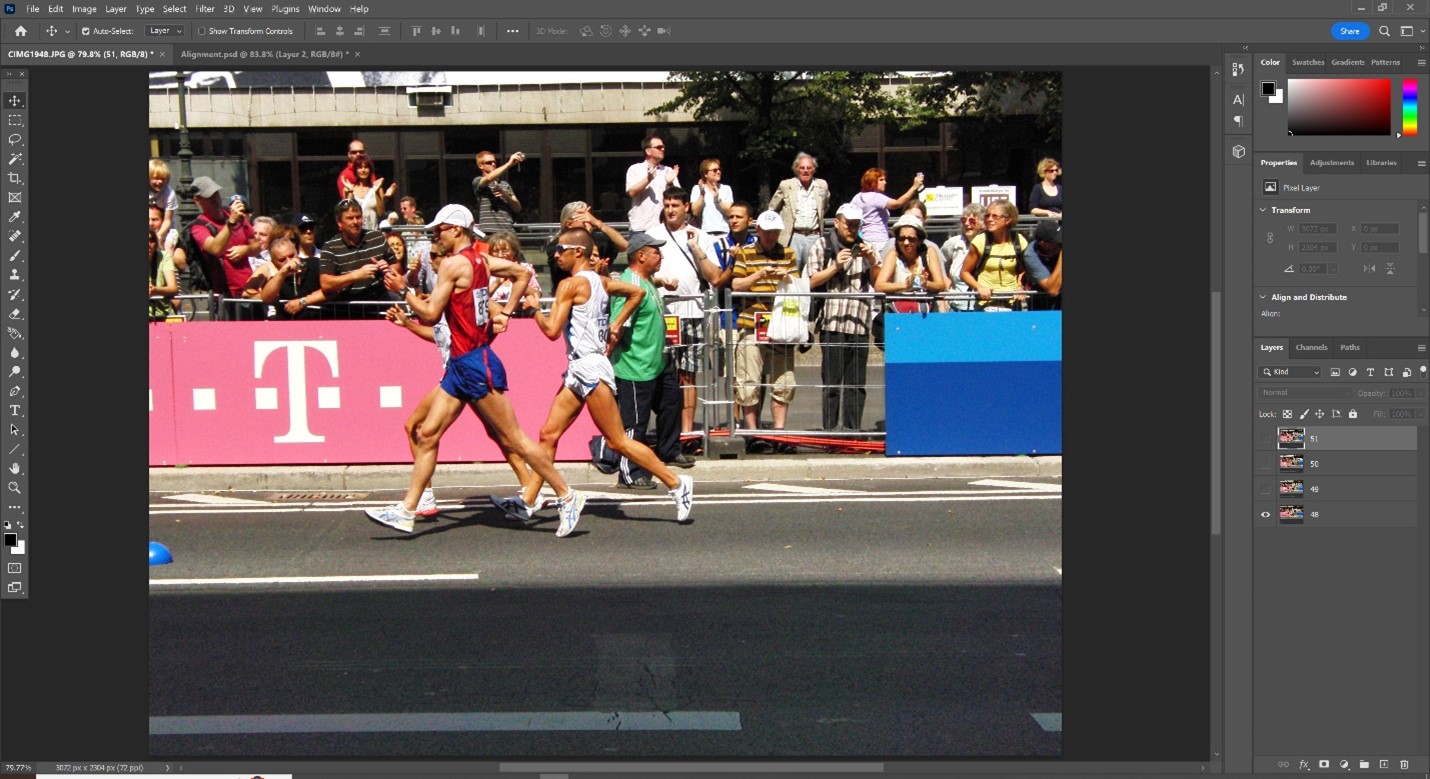 Figure 7A
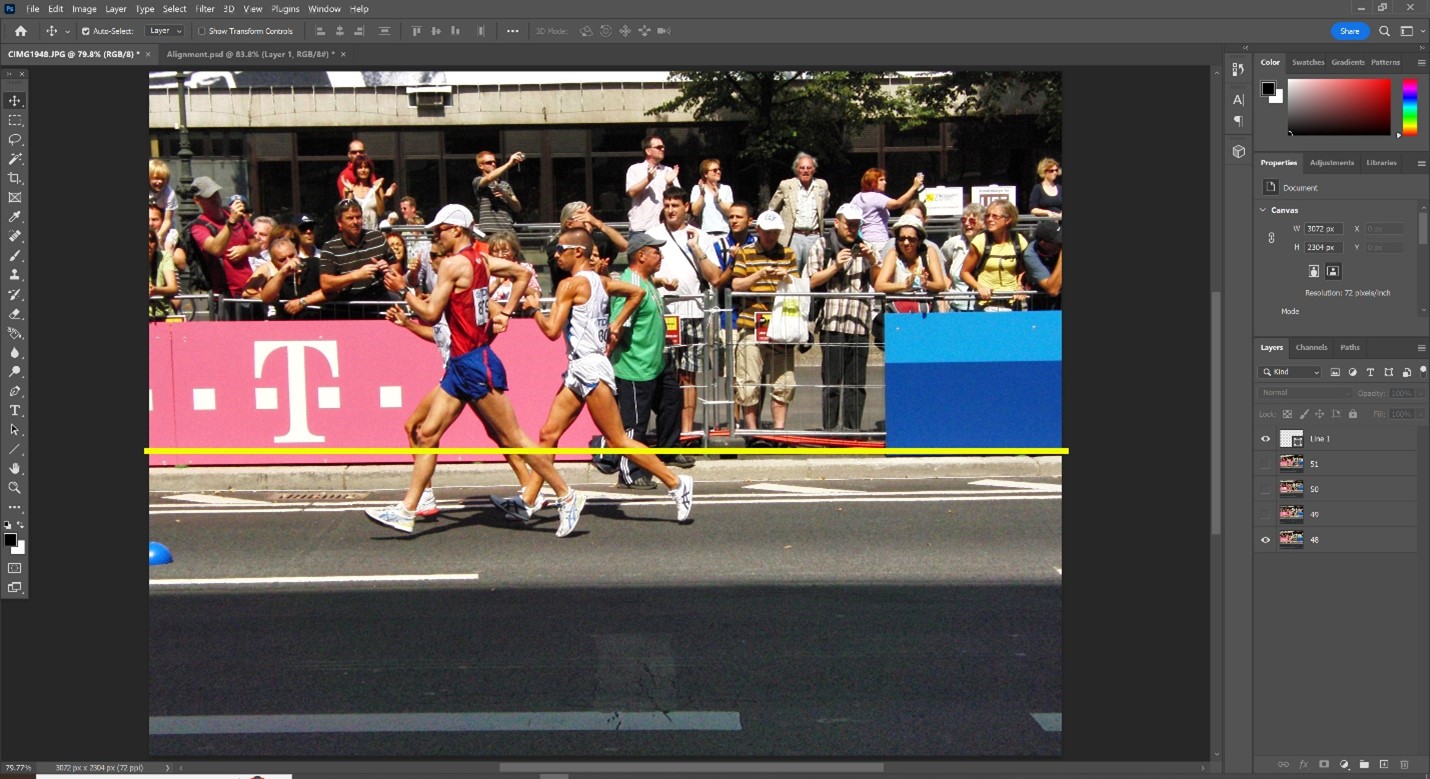 Figure 7B
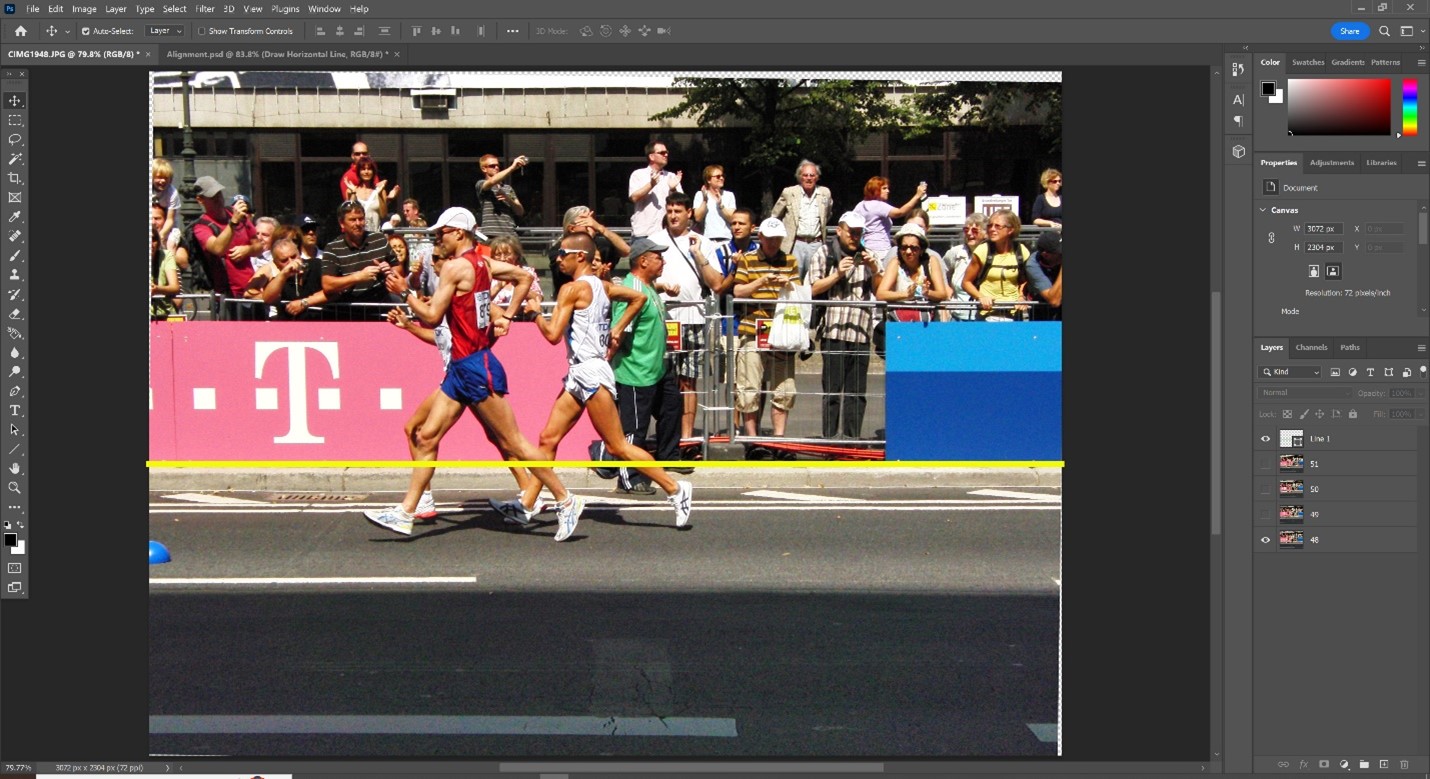 Figure 7C
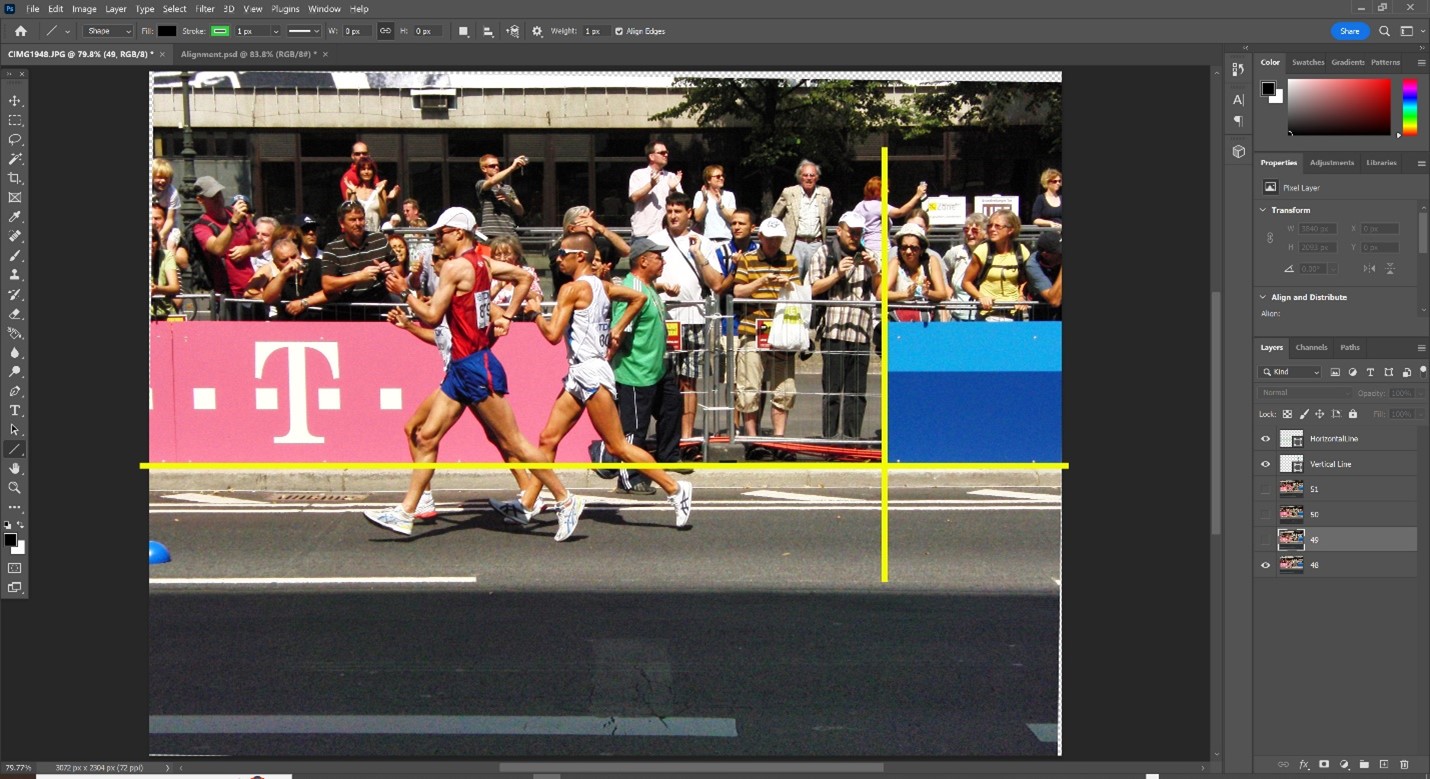 Figure 7D
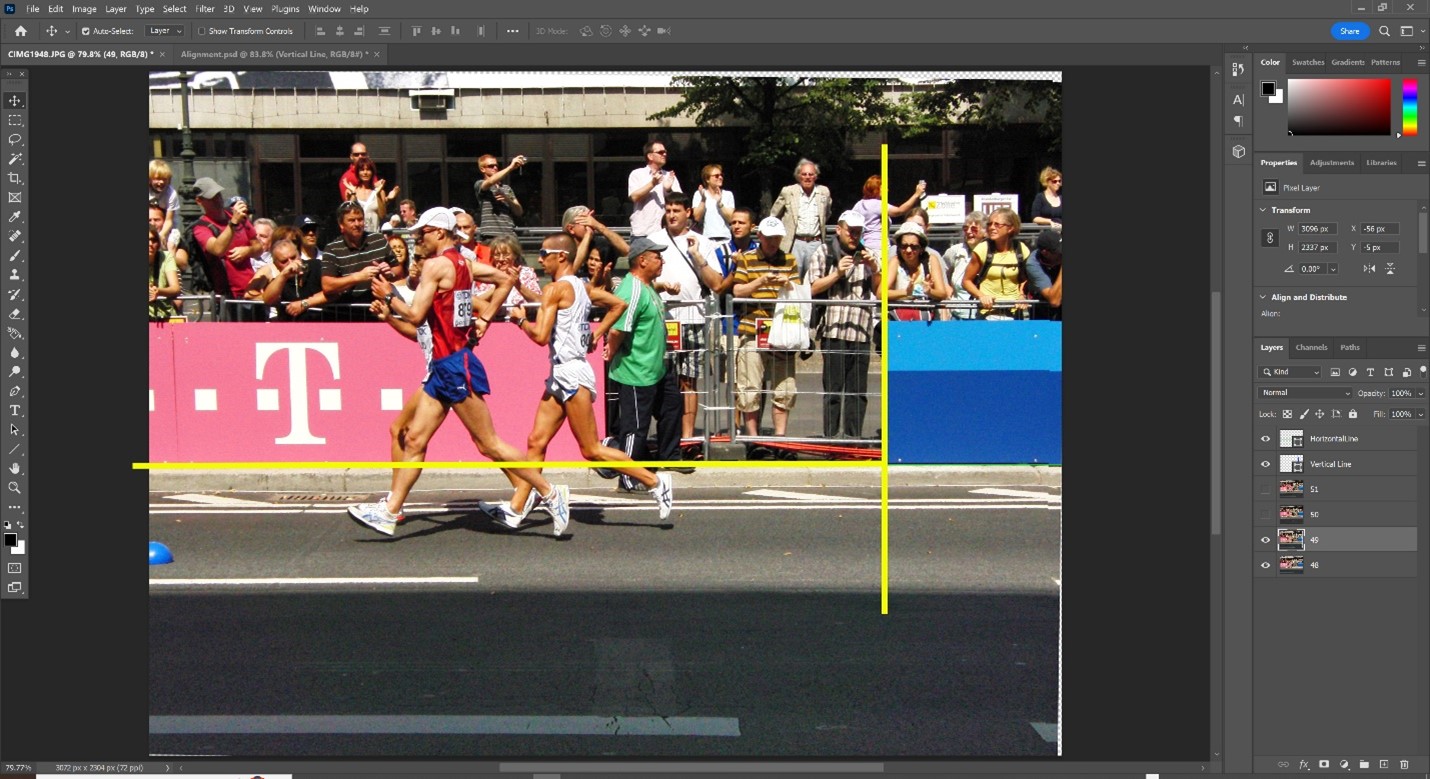 Figure 7E
Now the images can be compared as if they were shot on a tripod without the camera panning.